
Inspect a page
Inspect a page
See what the browser actually renders: spacing, type, color and CSS for any element, without opening DevTools.
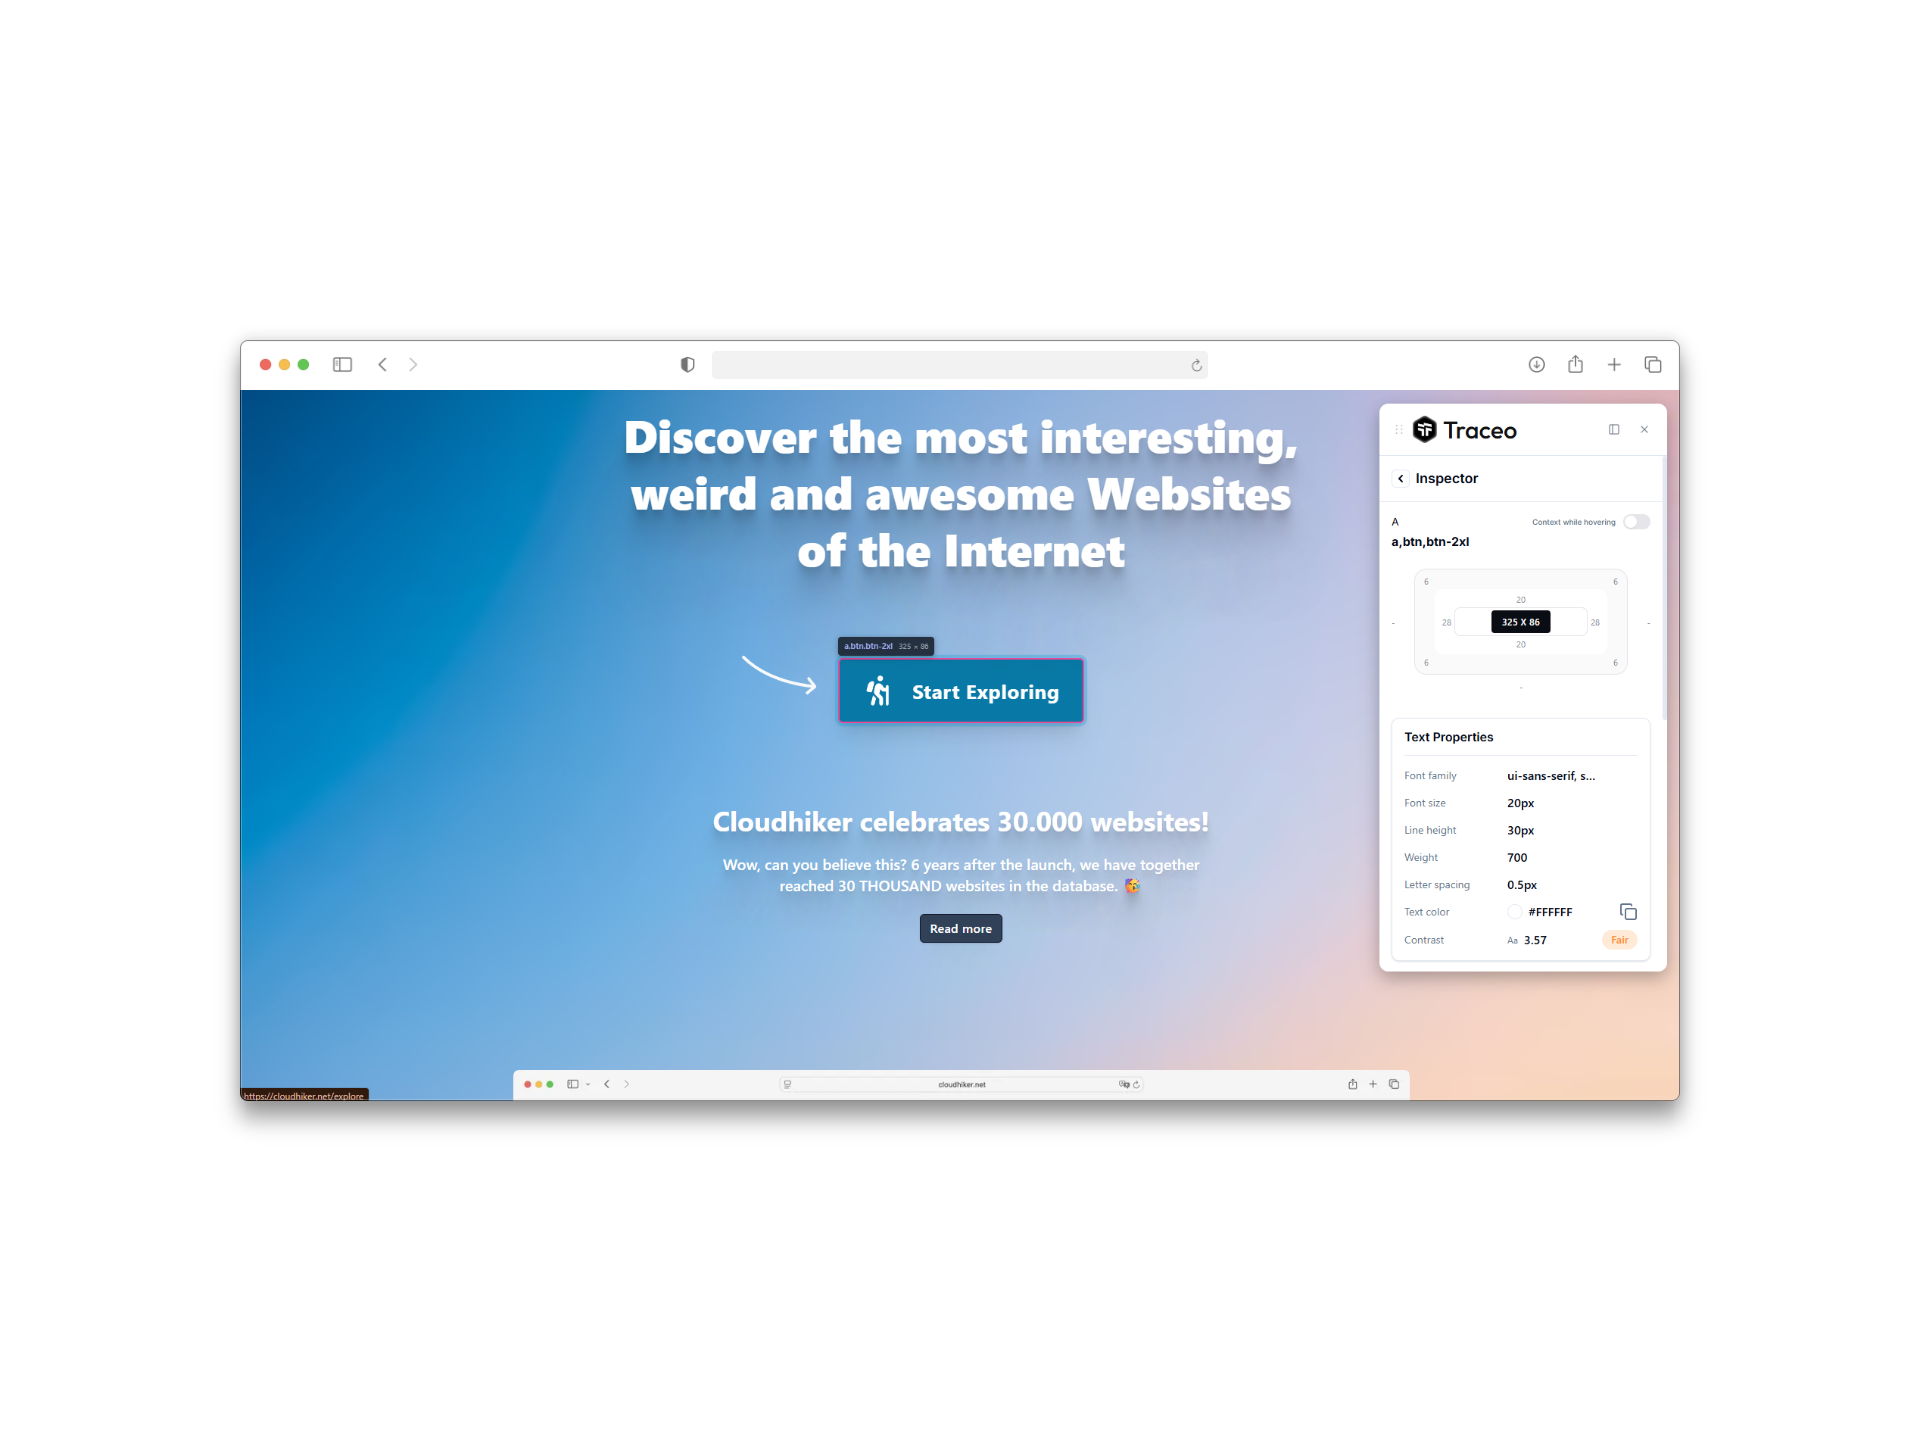
Element inspector
- Turn on the inspector
Open Traceo and choose Inspect. Your cursor now highlights elements as you move it.
- Hover or click an element
A card shows its size, text and background color, font family, size, weight and line height, padding and margin. Click to lock the selection and open the full details.
- Copy what you need
Click any value to copy it. Press Esc to stop inspecting.
Outline every box
The outline debugger (Pesticide) draws a border around every element, so overflowing containers, misaligned columns and unexpected gaps stand out. Change the outline depth, thickness and colors in its settings. You can give it a keyboard shortcut at chrome://extensions/shortcuts.
More inspection tools
Preview the page at phone, tablet and desktop sizes side by side, with scrolling kept in sync, and capture an issue from the breakpoint where it happens.
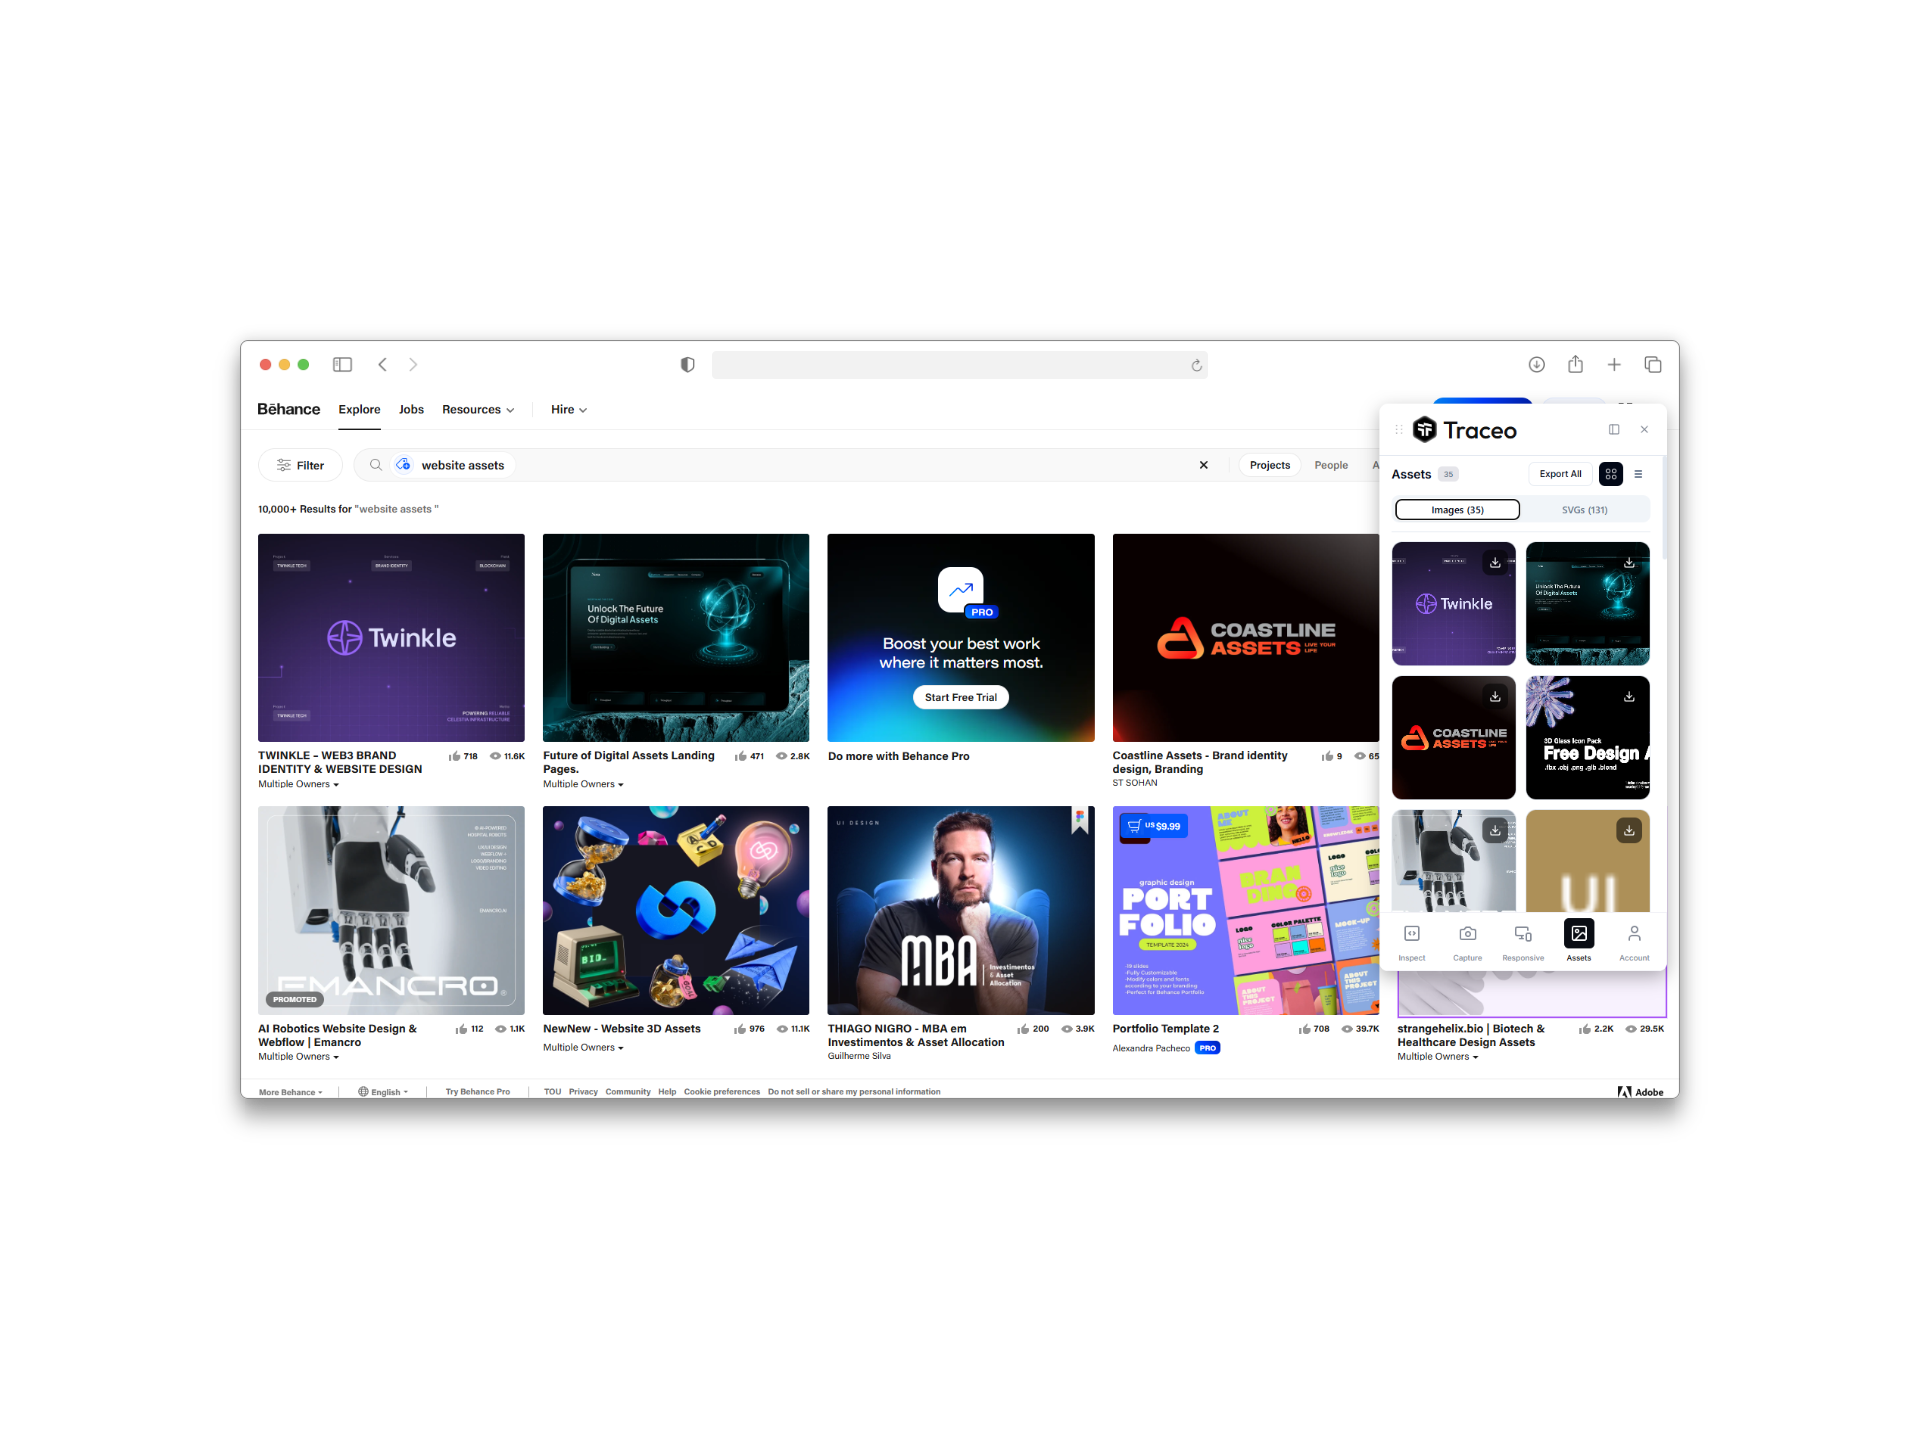
Scan the page for images, icons and SVGs, filter them, and download the ones you need in one go.
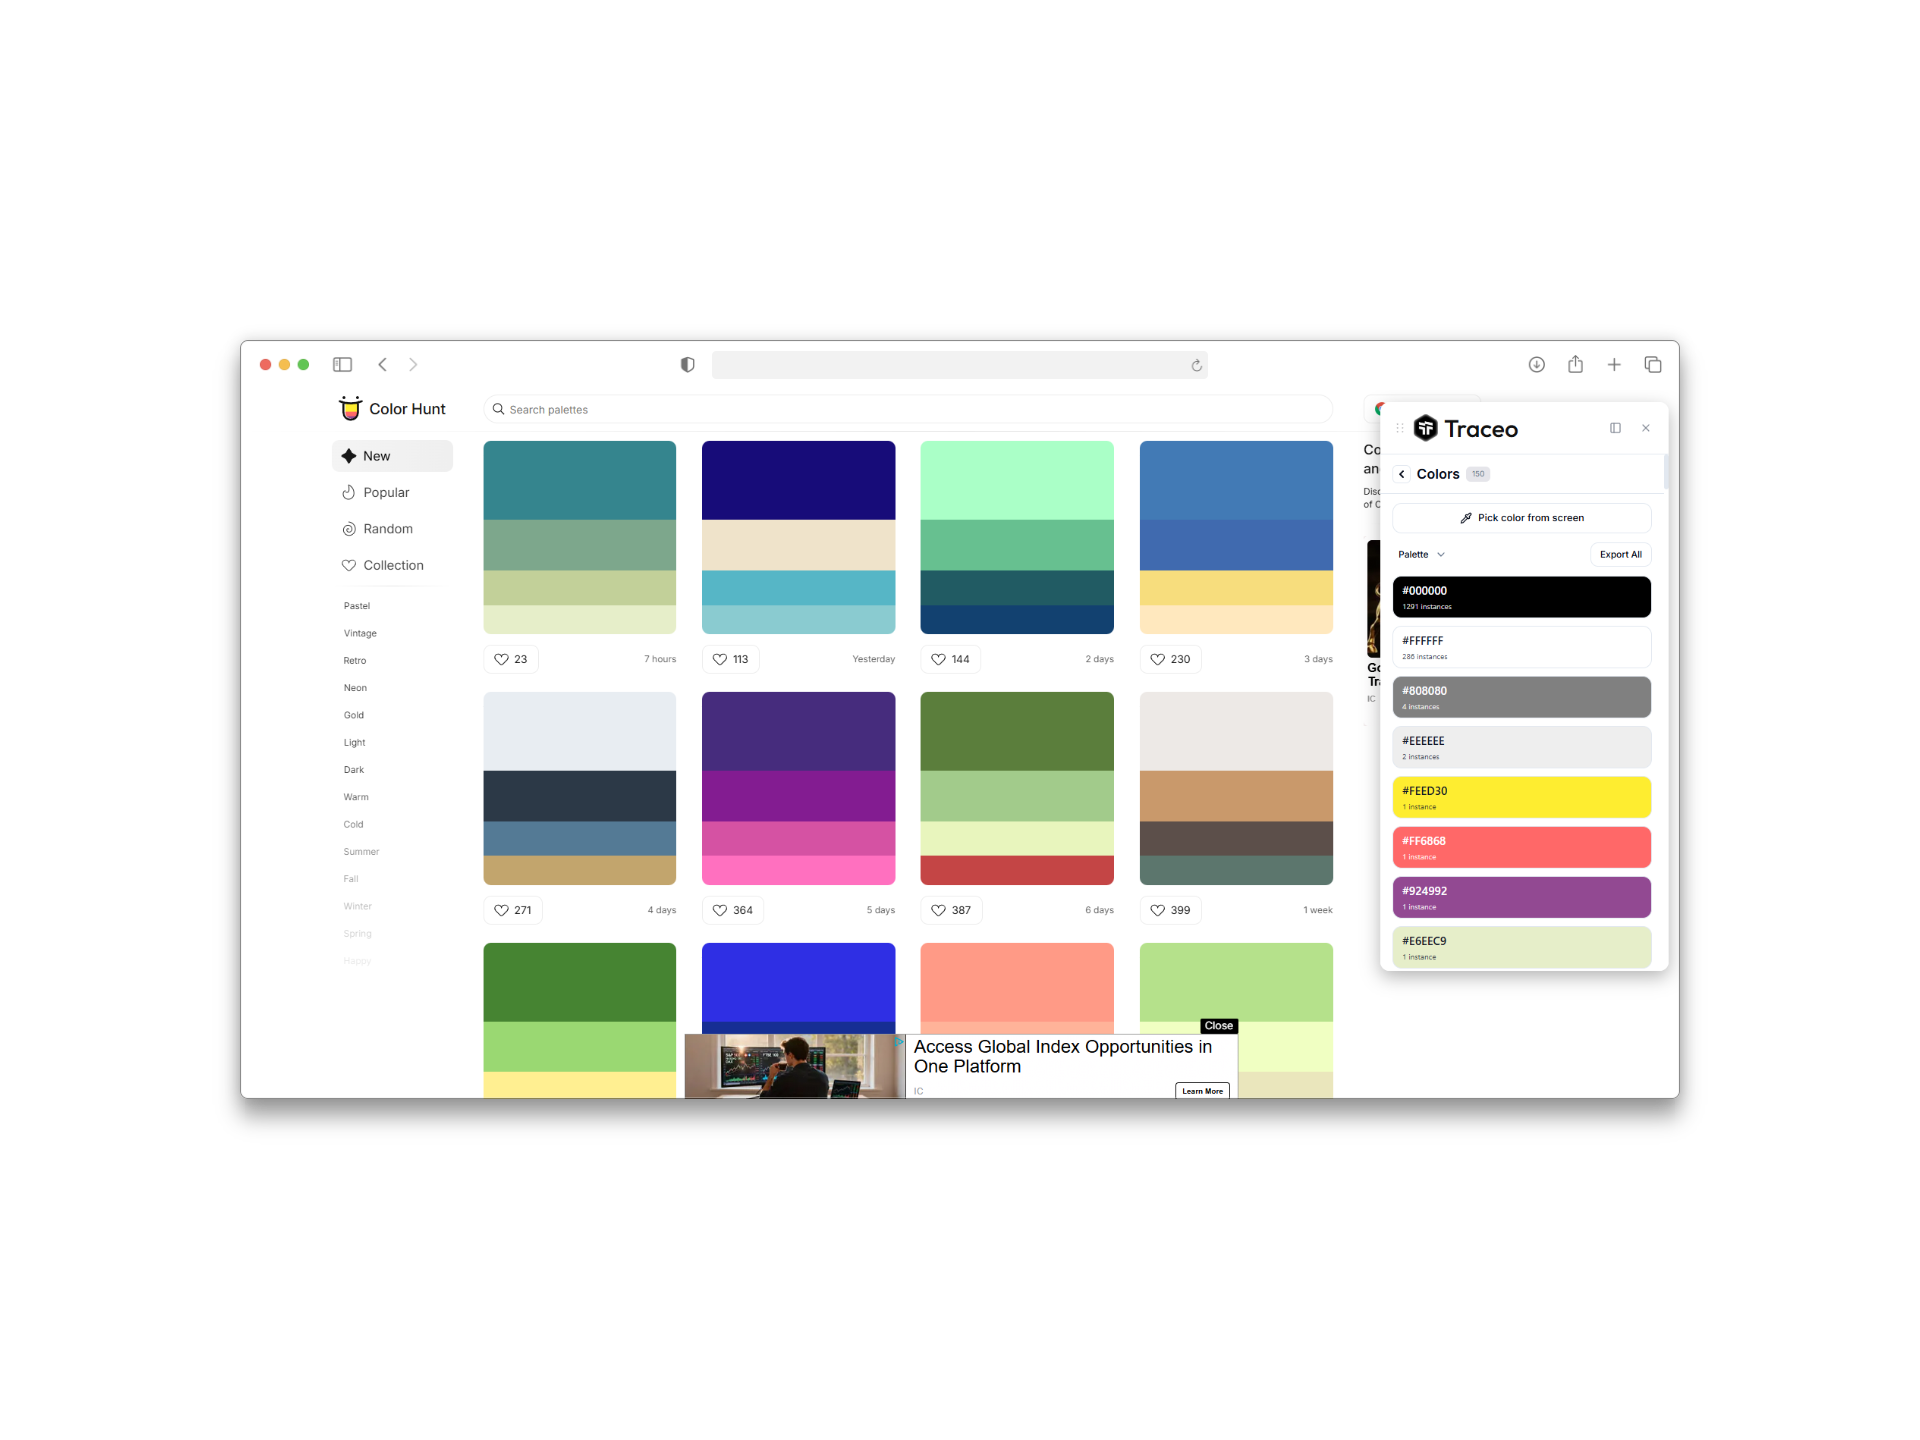
See the palette, the type scale and contrast problems for the whole page.

Point at a component and copy its structure and styles as a ready-made prompt for Cursor, Claude or Copilot.
Keep Traceo open while you browse
Traceo can run as a floating panel over the page or in Chrome's side panel. Use the side panel when you:
- move between pages and want the inspector to stay where it is,
- need the whole page visible while you read values,
- review a flow across several screens.
Traceo remembers which mode you used last.