
Getting started
Getting started
Inspect any live page and capture UI bugs with the context developers need. One Chrome extension for designers, developers and QA.

Traceo turns “the button looks wrong” into values you can check and evidence you can share. Inspect spacing, type and color on the page itself, then capture a screenshot or a recording with the console, network requests and clicks attached, and share it as one link.
Install and sign in
- Add Traceo to Chrome
Install it from the Chrome Web Store, then pin it so the icon stays in your toolbar.
- Open it on any page
Click the Traceo icon. It opens as a floating panel over the page, or in Chrome's side panel so it stays open while you navigate.
- Sign in to share
Inspecting works without an account. Sign in with email or Google to share recordings, keep a library on traceo.dev and send to Slack.
Two things Traceo does
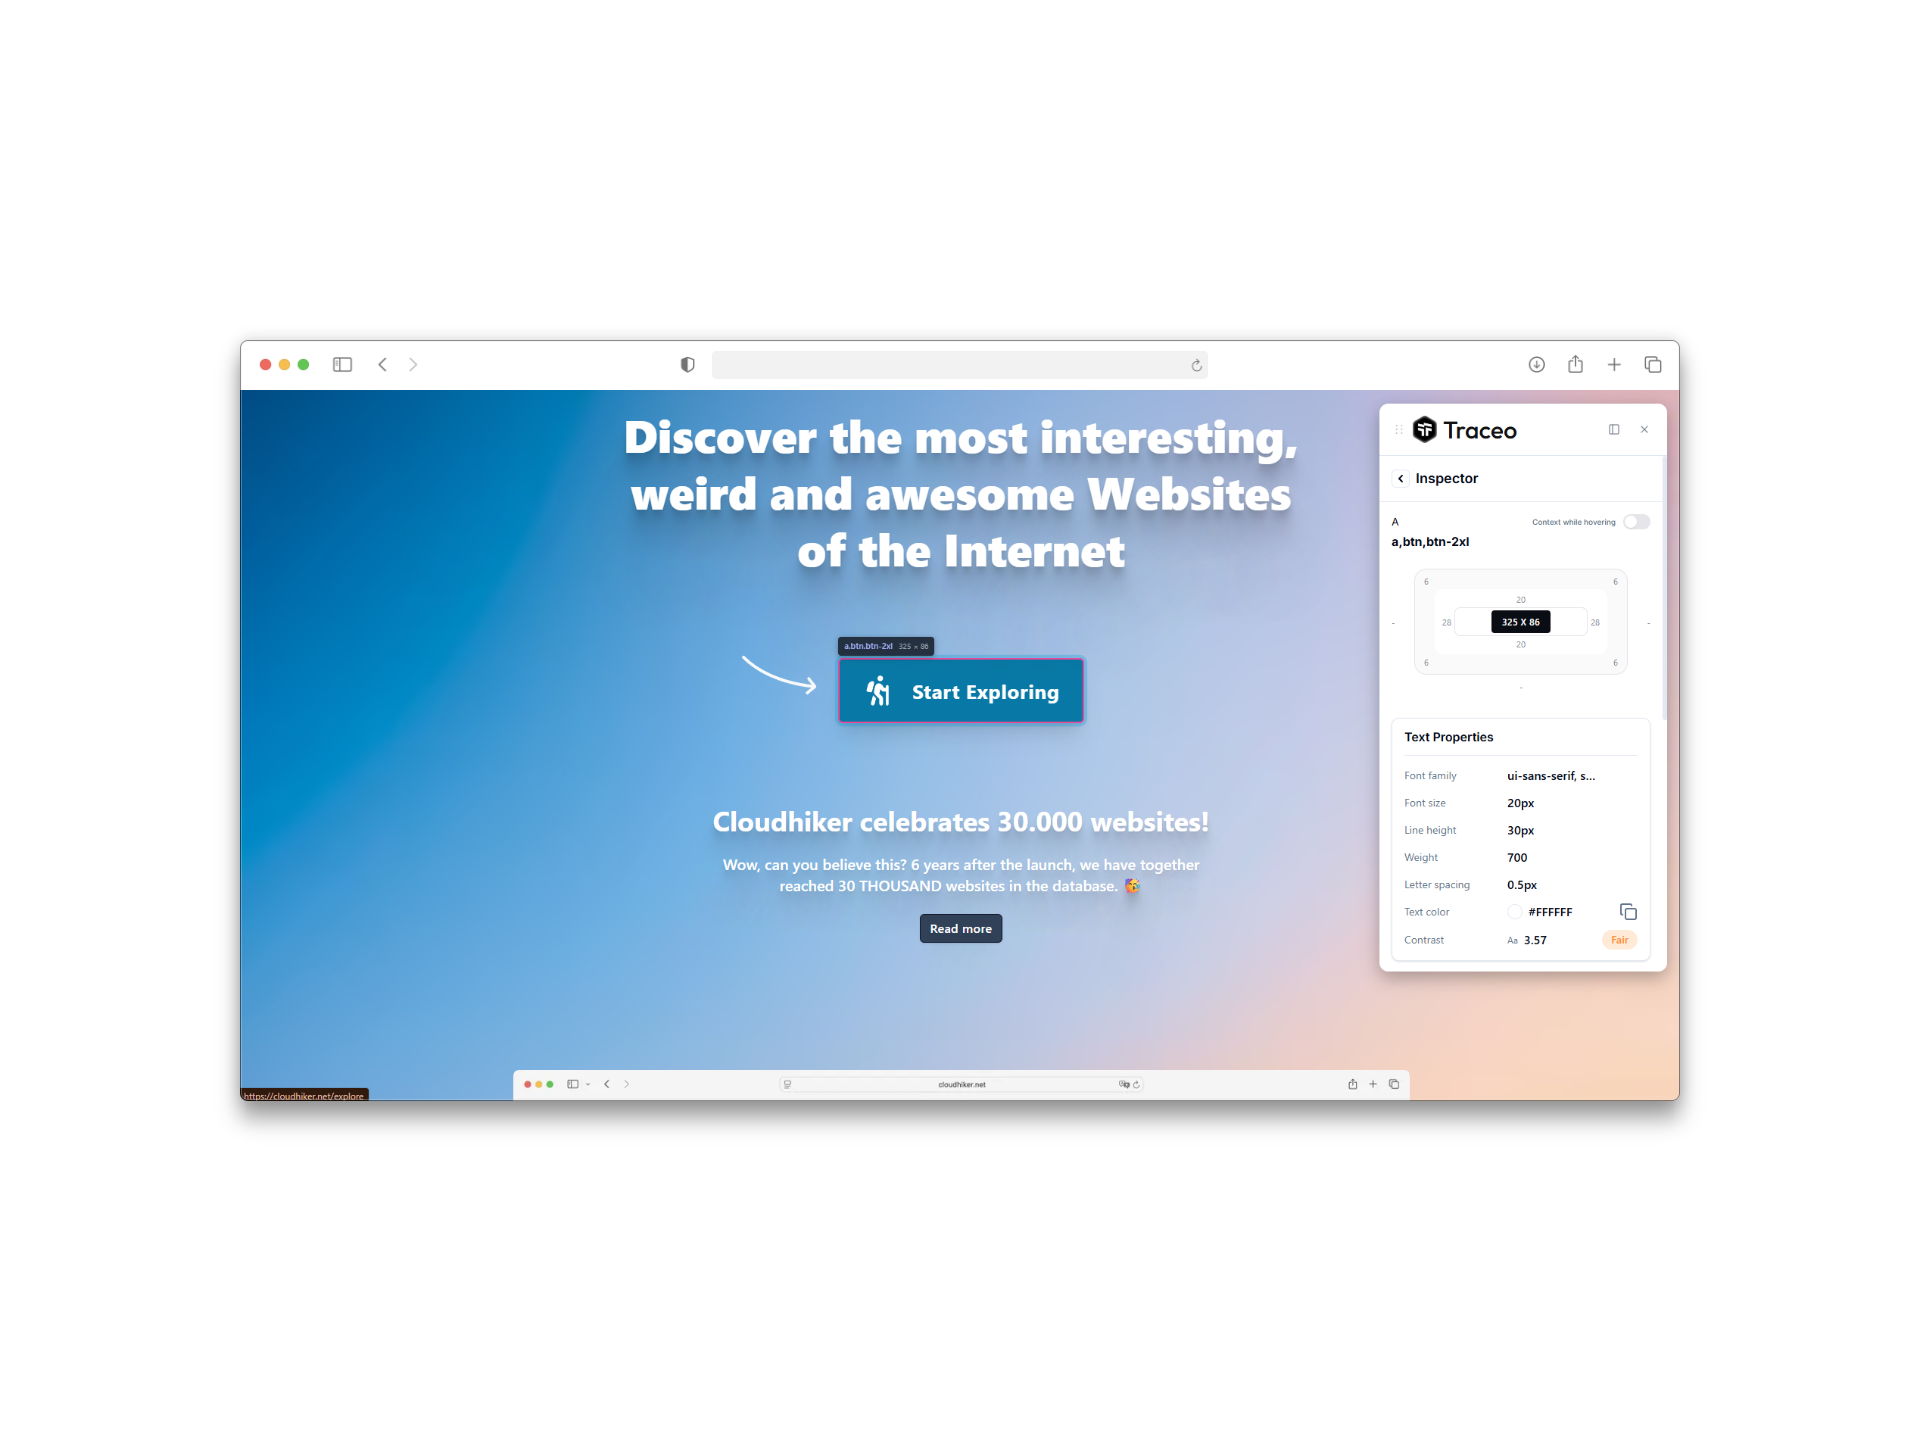
Spacing, type, color, radius and CSS on any element, outlines for every box, and responsive previews. No DevTools needed.

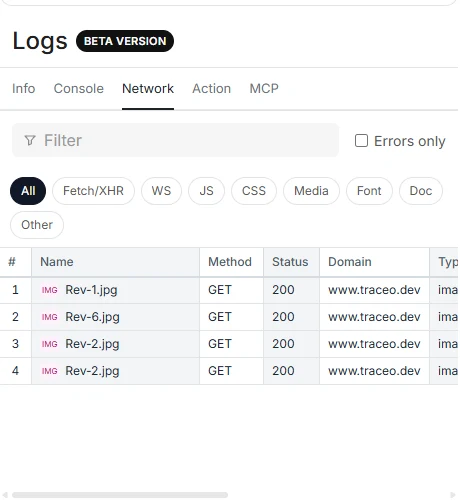
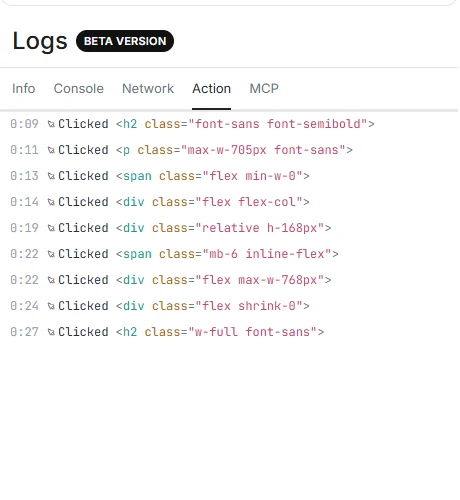
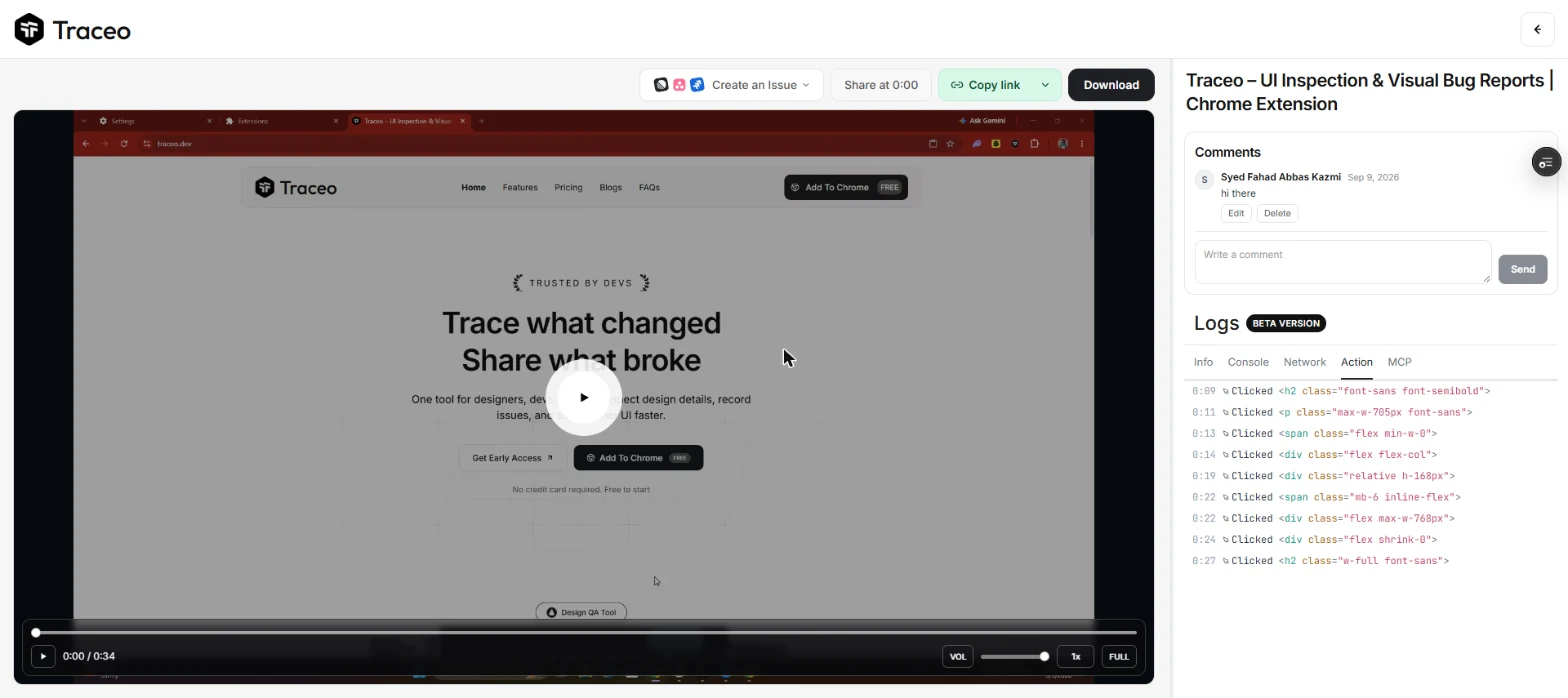
Screenshots with markup, and recordings with console, network and clicks attached, shared as one link.
| Use it to | Best for |
|---|---|
| Check a build against the design | Designers and frontend developers reviewing spacing, type and color on a live URL. |
| Report a bug that can be reproduced | QA and support sending a recording with the console and network instead of a vague description. |
| Hand a bug to an AI agent | Developers pasting a recording link into Claude, Cursor or Codex to find the cause. |
What a recording captures
Every shared recording carries the context needed to reproduce the bug, not just the video.
Handy shortcuts
Press Esc to stop the element inspector. To toggle the outline debugger from the keyboard, open chrome://extensions/shortcutsand give “Toggle Outline Debugger” a key you like.